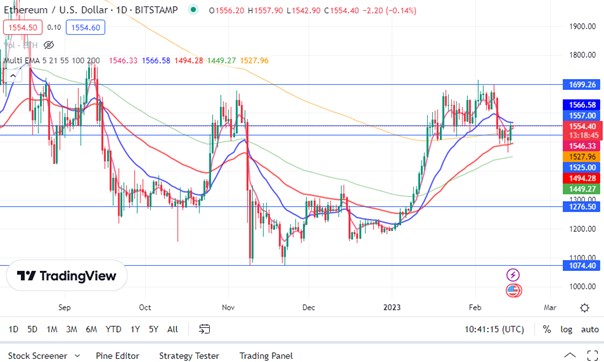
Ethereum, which had withdrawn before the inflation data from the USA, also experienced a rapid rise after the inflation data was announced as 6.4 on an annual basis. Could this rise be the beginning of a new trend? Or will it remain a reaction? At the time of writing, Ethereum is trading at $ 1554 with a daily decrease of 0.14%.

Ethereum chart analysis
Ethereum, which has fallen by about 14% from $ 1700 to $ 1460 in the last six days, closed the day at $ 1556 with an increase of 3.33% after yesterday’s inflation data announcement. When we examine the chart above, it is seen that the Ethereum chart is stuck in a narrow band between EMA5 and EMA21, similar to the Bitcoin chart. In this direction, the $1546 level, the daily EMA5, is the first support point, and the $1566 level, the EMA21, is the first resistance point.

This article does not contain investment advise or recommendations. Every investment and trading move involves risk, and readers should conduct their own research when making a decision.
You may be interested in: BitDAO Coin: What You Need to Know and Important Information

